Fluid Developer Tools (DevTools)
As Fluid Framework abstracts away the complexities of dealing with real-time collaborative data, it is crucial that developers have access to the underlying state when debugging their Fluid-based applications. Fluid Developer Tools (Fluid DevTools) is a browser extension that lets developers debug their Fluid-based applications. It is built as an extension of the browser developer tools that is already part of many developers' workflows. It is open-source, extensible and community contributions are welcome at https://aka.ms/fluid/devtool. The Fluid DevTools provides access to the following features:
- Container information and data visualization
- Ability to modify container state for testing offline and reconnect scenarios
- Visibility into audience membership, permissions, and join/leave logs
- Framework event logs to view performance and error events
To use the Fluid DevTools, developers need to follow two simple steps:
- Integrate the Fluid DevTools library into your app using these steps: https://aka.ms/fluid/devtool
- See DevTools integrated into samples at https://aka.ms/fluid/samples
- Install the Fluid DevTools browser extension from Edge or Chrome extension stores
Once you have completed the above steps, you can simply launch your Fluid application in a browser window and start the browser DevTools by right-clicking and selecting Inspect. In the browser DevTools window, you should see a tab for Fluid Developer Tools
Container Information
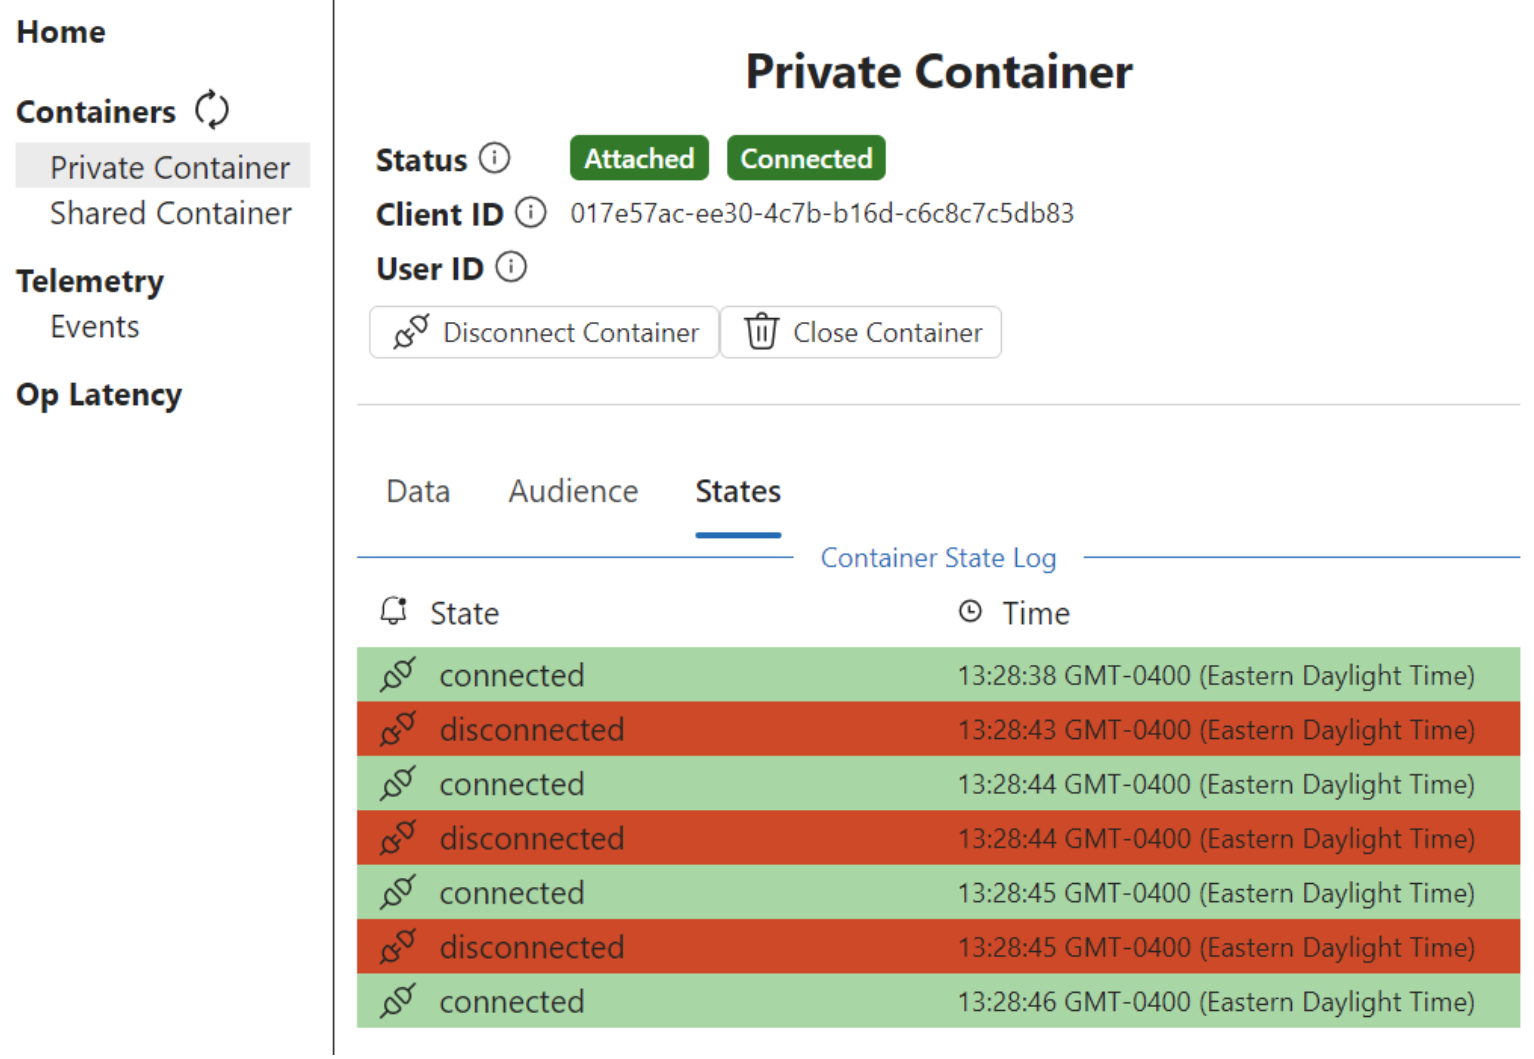
DevTools shows the containers that were specified in the initialization, their current state (connected, attached, disconnected) and allows developers to modify the state (disconnect, close). Developers can also see a lot of container state changes with timestamps.
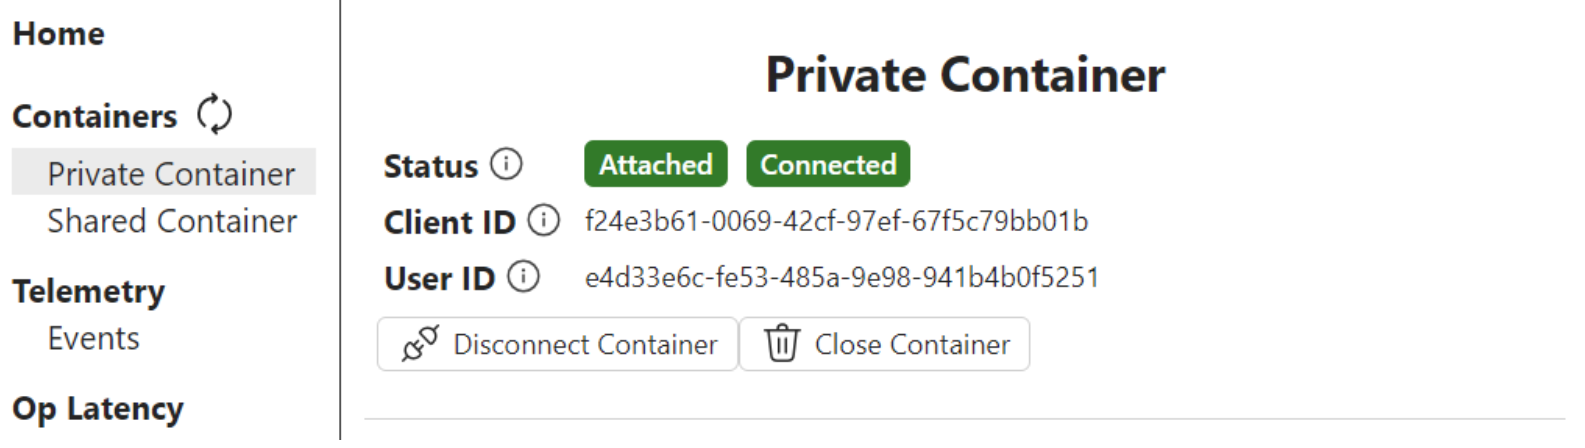
- Disconnect/Reconnect Container button disconnects it from the Fluid service
- Close Container button stops the container, including disconnecting it from the Fluid service
These buttons can be used to test the following scenarios:
- Offline state - Test how your app will behave if connection drops in the middle of a collab session
- Merge edge cases - Test how your app reacts to various merging scenarios when multiple users work offline and come back online
- Container cleanup - Test how your app behaves when a container is closed and disposed off.
Data Visualization
DevTool shows the current container data including all the DDSs that are part of the container. Currently, the DevTool supports renderers for SharedTree, SharedMap, SharedString, SharedCounter and Sequences. Because of the extensible model of the framework, you can also build and add renderers for custom DDSs.
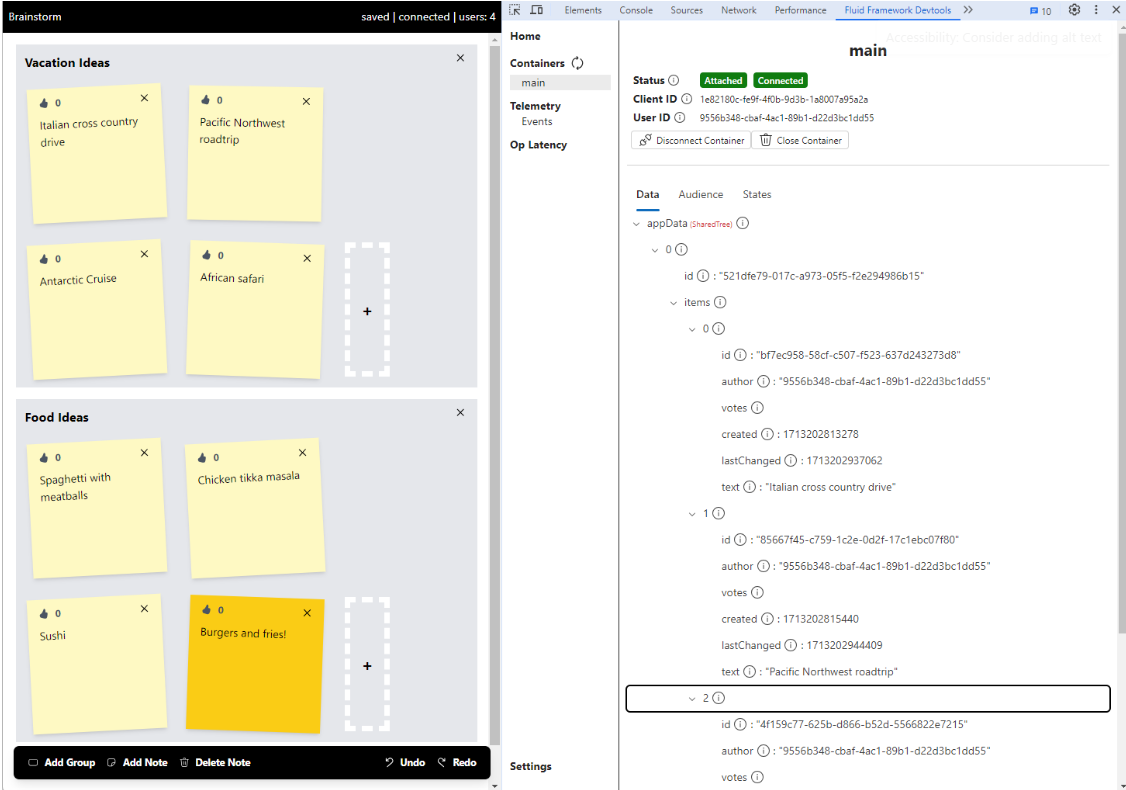
The DDS visualizer updates in real-time as local and remote changes impact the container data. Getting a peek at the underlying data and checking it against what's rendered in your app should allow you to look for any inconsistencies between the data and your app UI.
Audience Info
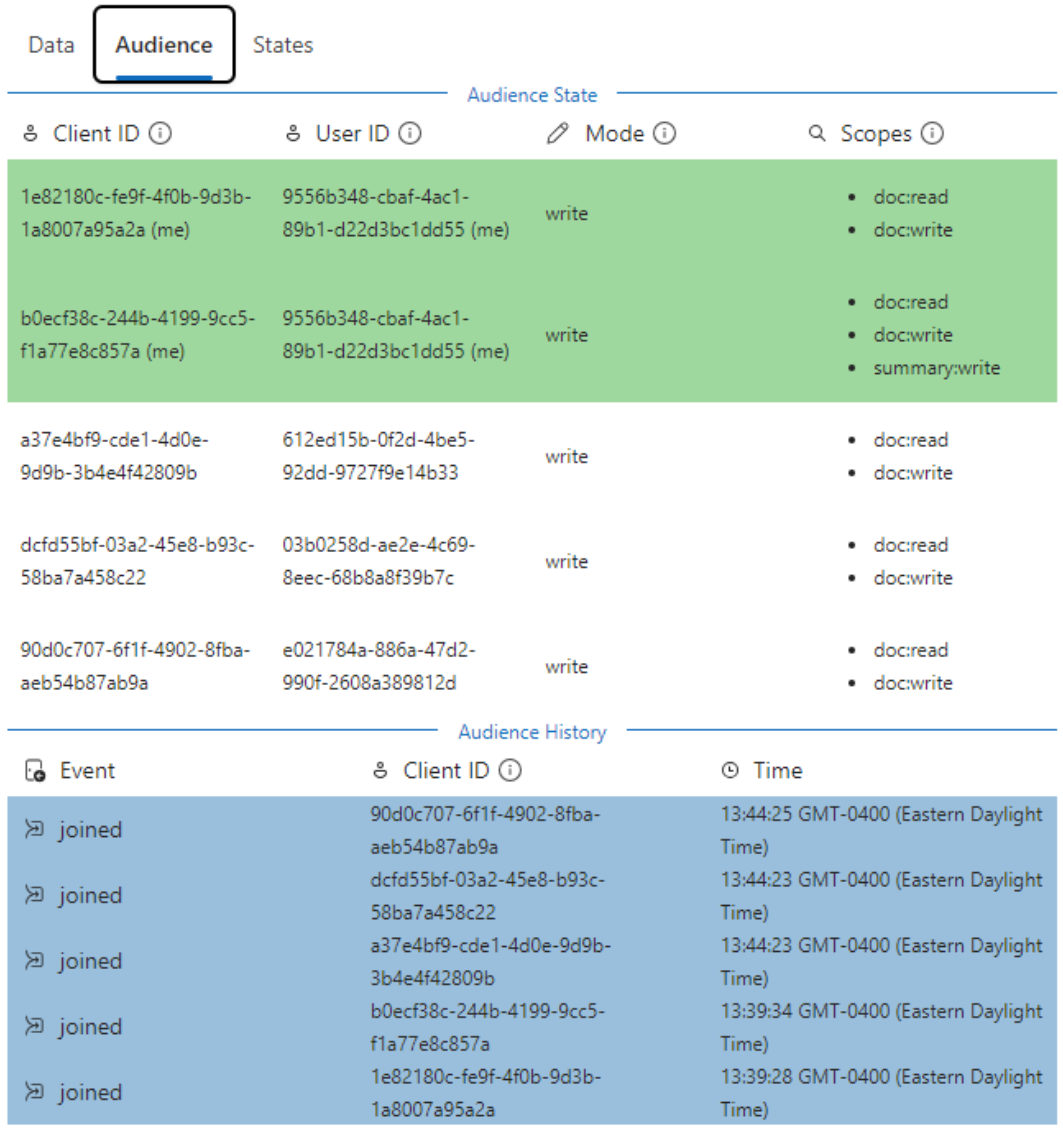
DevTool displays a list of clients that are connected to the container(s) in the application and their connection type (read-only or read/write). The tool also shows a log of clients joining and leaving the container. This can be used to debug user presence indicators in your apps.
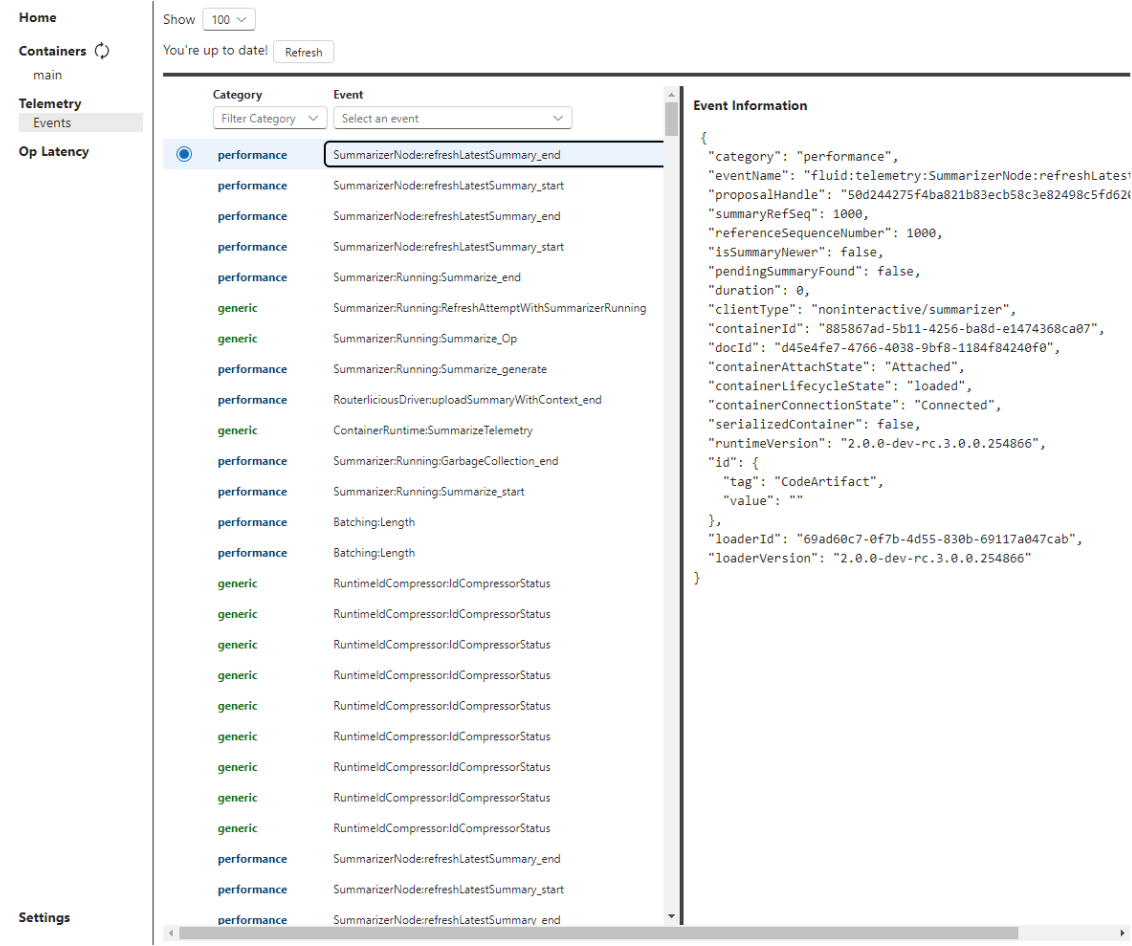
Framework Event Logs
DevTool outputs a log of events happening in the framework including info, performance (e.g. Ops latency) and errors. These logs provide a peek at the inner workings of Fluid that you can use to monitor your apps
Ops Latency Telemetry Graph
DevTool shows a graph of the operations it generates to handle real-time collaboration and a breakdown of their processing times. Developer can see that time broken down into:
- Outbound duration - time spent processing locally by Fluid before sending an op
- Network duration - roundtrip network time
- Inbound duration - time Fluid took to process the response after receiving a server response
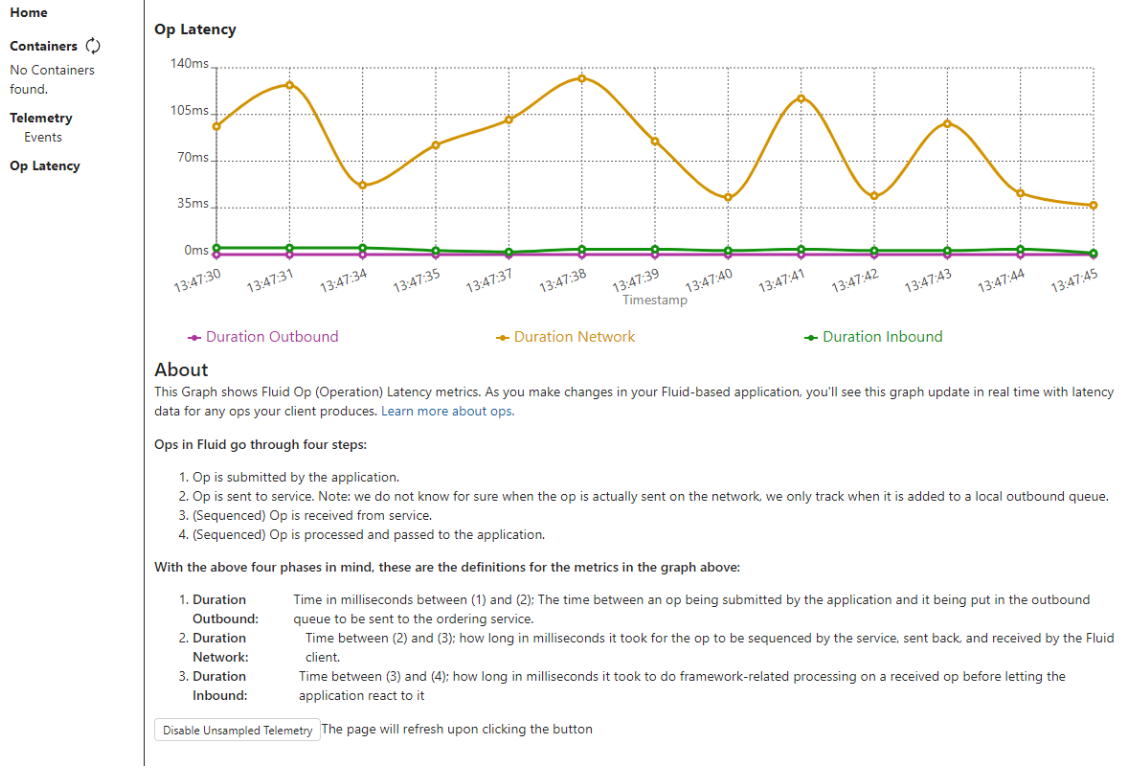
This graph should help you debug latency issues and pinpoint where the delays are happening when used in conjunction with your app's own telemetry.