Typed telemetry
Fluid Framework contains code enabling the production and consumption of stable typed telemetry for Fluid Framework applications. The typed telemetry is used as the backbone for different Fluid Framework cloud offerings such as dashboards and alarms for Fluid applications. This package can also be used as a reference for customizing and creating your own telemetry solution if desired.
At this time, the package enables collection of telemetry related to the Fluid container only. In the future, more areas would be added as needs evolve. This telemetry is strongly typed and backed by versioning semantics to avoid un-planned or un-expected breaks in telemetry.
Getting Started
Let's walk through some examples for getting started with Fluid telemetry for containers using the @fluidframework/fluid-telemetry package.
Use Case 1: Logging container telemetry to Azure App Insights and analyzing app data
Prerequisite
Before you can get telemetry sent to Azure App Insights, you'll need to create an Instance of App Insights on Azure. You'll then be able to integrate your Azure App Insights instance with your Fluid application and route your Fluid container application telemetry to App Insights. Learn more about Azure App Insights. Creating your App Insights instance.
Once you setup your App Insights instance, you can proceed with next steps below to route the telemetry to App Insights.
Step 1: Install new package dependencies
Install the Fluid Framework telemetry package and Azure App Insights package dependencies
- Using npm:
npm install @fluidframework/fluid-telemetry @microsoft/applicationinsights-web
Step 2: Setup telemetry collection
Now, let's start the telemetry production by initializing our telemetry collection where we initialize our containers:
import { ApplicationInsights } from "@microsoft/applicationinsights-web";
import { IFluidContainer } from "@fluidframework/fluid-static";
import { ITelemetryConsumer , TelemetryConfig, startTelemetry, IFluidTelemetry } from "@fluidframework/fluid-telemetry"
import { AppInsightsTelemetryConsumer } from "@fluidframework/fluid-telemetry"

// 1: This is supposed to be your code for creating/loading a Fluid Container
let myAppContainer: IFluidContainer;
let myAppContainerId: string;
if (containerExists) {
    myAppContainerId = {...your code to get the id of the existing container}
    myAppContainer = {...your code to load a Fluid Container from myAppContainerId}
} else {
    myAppContainer = {...your code to create a new Fluid Container}
    myAppContainerId = await myAppContainer.attach();
}

// 2a: Instantiate our Azure App Insights Client
const appInsightsClient = new ApplicationInsights({
    config: {
        connectionString:
            /////////////// Important ///////////////
            // Edit this with your app insights instance connection string which
            // can be found on the Azure Portal where you created the
            // App Insights instance (below is an example string)
            "InstrumentationKey=abcdefgh-ijkl-mnop-qrst-uvwxyz6ffd9c;IngestionEndpoint=https://westus2-2.in.applicationinsights.azure.com/;LiveEndpoint=https://westus2.livediagnostics.monitor.azure.com/",
    },
});

// 2b: Initializes the App Insights client. Without this, logs will not be sent to Azure.
appInsightsClient.loadAppInsights();

// 3: Next, we'll create the telemetry config object.
// Note that we have to obtain the containerId before we can do this.
const telemetryConfig: TelemetryConfig = {
    container: myAppContainer,
    containerId: myAppContainerId,
    // We import AppInsightsTelemetryConsumer from the fluid-telemetry package
    consumers: [new AppInsightsTelemetryConsumer(appInsightsClient)],
};

// 4. Start Telemetry
startTelemetry(telemetryConfig);

// Done! Your container telemetry is now being created and sent to your Telemetry Consumer which will forward it to Azure App Insights.
That's it for now! If you've decided to use Azure App Insights, we have designed useful prebuilt queries that utilize the generated telemetry. You can try out these queries after running your application with above code for a little duration.
You can find these queries in the "Interpreting Telemetry Data" section below.
Use Case 2: Setup a custom telemetry consumer
To use a custom telemetry consumer and integrate with a cloud provider or custom dashboard solution, you need to implement the ITelemetryConsumer interface.
In this example, you'll walk through the basic setup process to start getting container telemetry to be produced and log it to the console.
Step 1: Install package dependencies
Install the Fluid Framework telemetry package dependency
- Using npm:
npm install @fluidframework/fluid-telemetry
Step 2: Define a custom telemetry consumer
Here we'll create our own telemetry consumer which extends the ITelemetryConsumer interface. Let's look at an example that will simply log the telemetry to console.
import { ITelemetryConsumer, IFluidTelemetry } from "@fluidframework/fluid-telemetry";

class MySimpleTelemetryConsumer implements ITelemetryConsumer {
	consume(event: IFluidTelemetry) {
		console.log(event);
	}
}
Step 3: Setup telemetry collection
Now, let's start the telemetry production and loop in our telemetry consumer from step 2. We will be initializing our telemetry collection where we initialize our containers:
import { IFluidContainer } from "@fluidframework/fluid-static";
import { ITelemetryConsumer , TelemetryConfig, startTelemetry, IFluidTelemetry } from "@fluidframework/external-telemetry"
// 1: import our implementation of MySimpleTelemetryConsumer from step 1
import { MySimpleTelemetryConsumer } from "./mySimpleTelmetryConsumer"

// 2: This is supposed to be your code for creating/loading a Fluid Container
let myAppContainer: IFluidContainer;
let myAppContainerId: string;
if (containerExists) {
    myAppContainerId = {...your code to get the id of the existing container}
    myAppContainer = {...your code to load a Fluid Container from myAppContainerId}
} else {
    myAppContainer = {...your code to create a new Fluid Container}
    myAppContainerId = await myAppContainer.attach();
}

// 3. Next, we'll create the telemetry config object.
// Note that we have to obtain the containerId before we can do this.
const telemetryConfig: TelemetryConfig = {
    container: myAppContainer,
    containerId: myAppContainerId,
    consumers: [new MySimpleTelemetryConsumer(appInsightsClient)],
};

// 4. Start Telemetry
startTelemetry(telemetryConfig);

// Done! Your container telemetry is now being created and sent to your Telemetry Consumer
You can now run the app and see the telemetry being printed on your console.
Interpreting telemetry data
This section provides a set of Azure App Insights queries related to collaborative sessions within a Fluid Framework application. It is intended to be used with the telemetry generated from @fluidframework/fluid-telemetry package whose integration steps are outline above.
Understanding container telemetry
Before we dive into the queries, we will walk through what a session or collaborative session is in the context of the following queries. Currently, the concept of a session or collaborative session does not actually exist within telemetry itself. At a high level, we identify a session by finding a set of container telemetry being emitted with the same container ID within a specific time frame.
Going into more detail, A Session or Collaborative Session is defined as a period in which we see a continuous stream of container telemetry being emitted with a unique container Id. For a given set of telemetry with the same container Id, if this stream of telemetry stops for longer than a specified period of time then we consider that the end of the session. Each session is differentiated from each other because it has no telemetry (no user activity) emitted for a defined amount of time prior to the start and after the end of emitted telemetry. For each of these queries you can also adjust the time gap that defines a session based on your preference.
Note: All telemetry being visualized below is generated from clients without any intervention from the server. The accuracy might be impacted due to inherent nature of client telemetry and data being lost due to faulty clients or lack of connectivity before the telemetry is fully pushed out. We recommend not using this telemetry for business metrics, but rather use it for operational metrics and diagnosis of issues.
Accessing App Insights Portal
Before we can query, we must first navigate to your Azure App Insights telemetry page. To do this, go to your Azure App Insights Instance and click on the Logs tab under Monitoring.
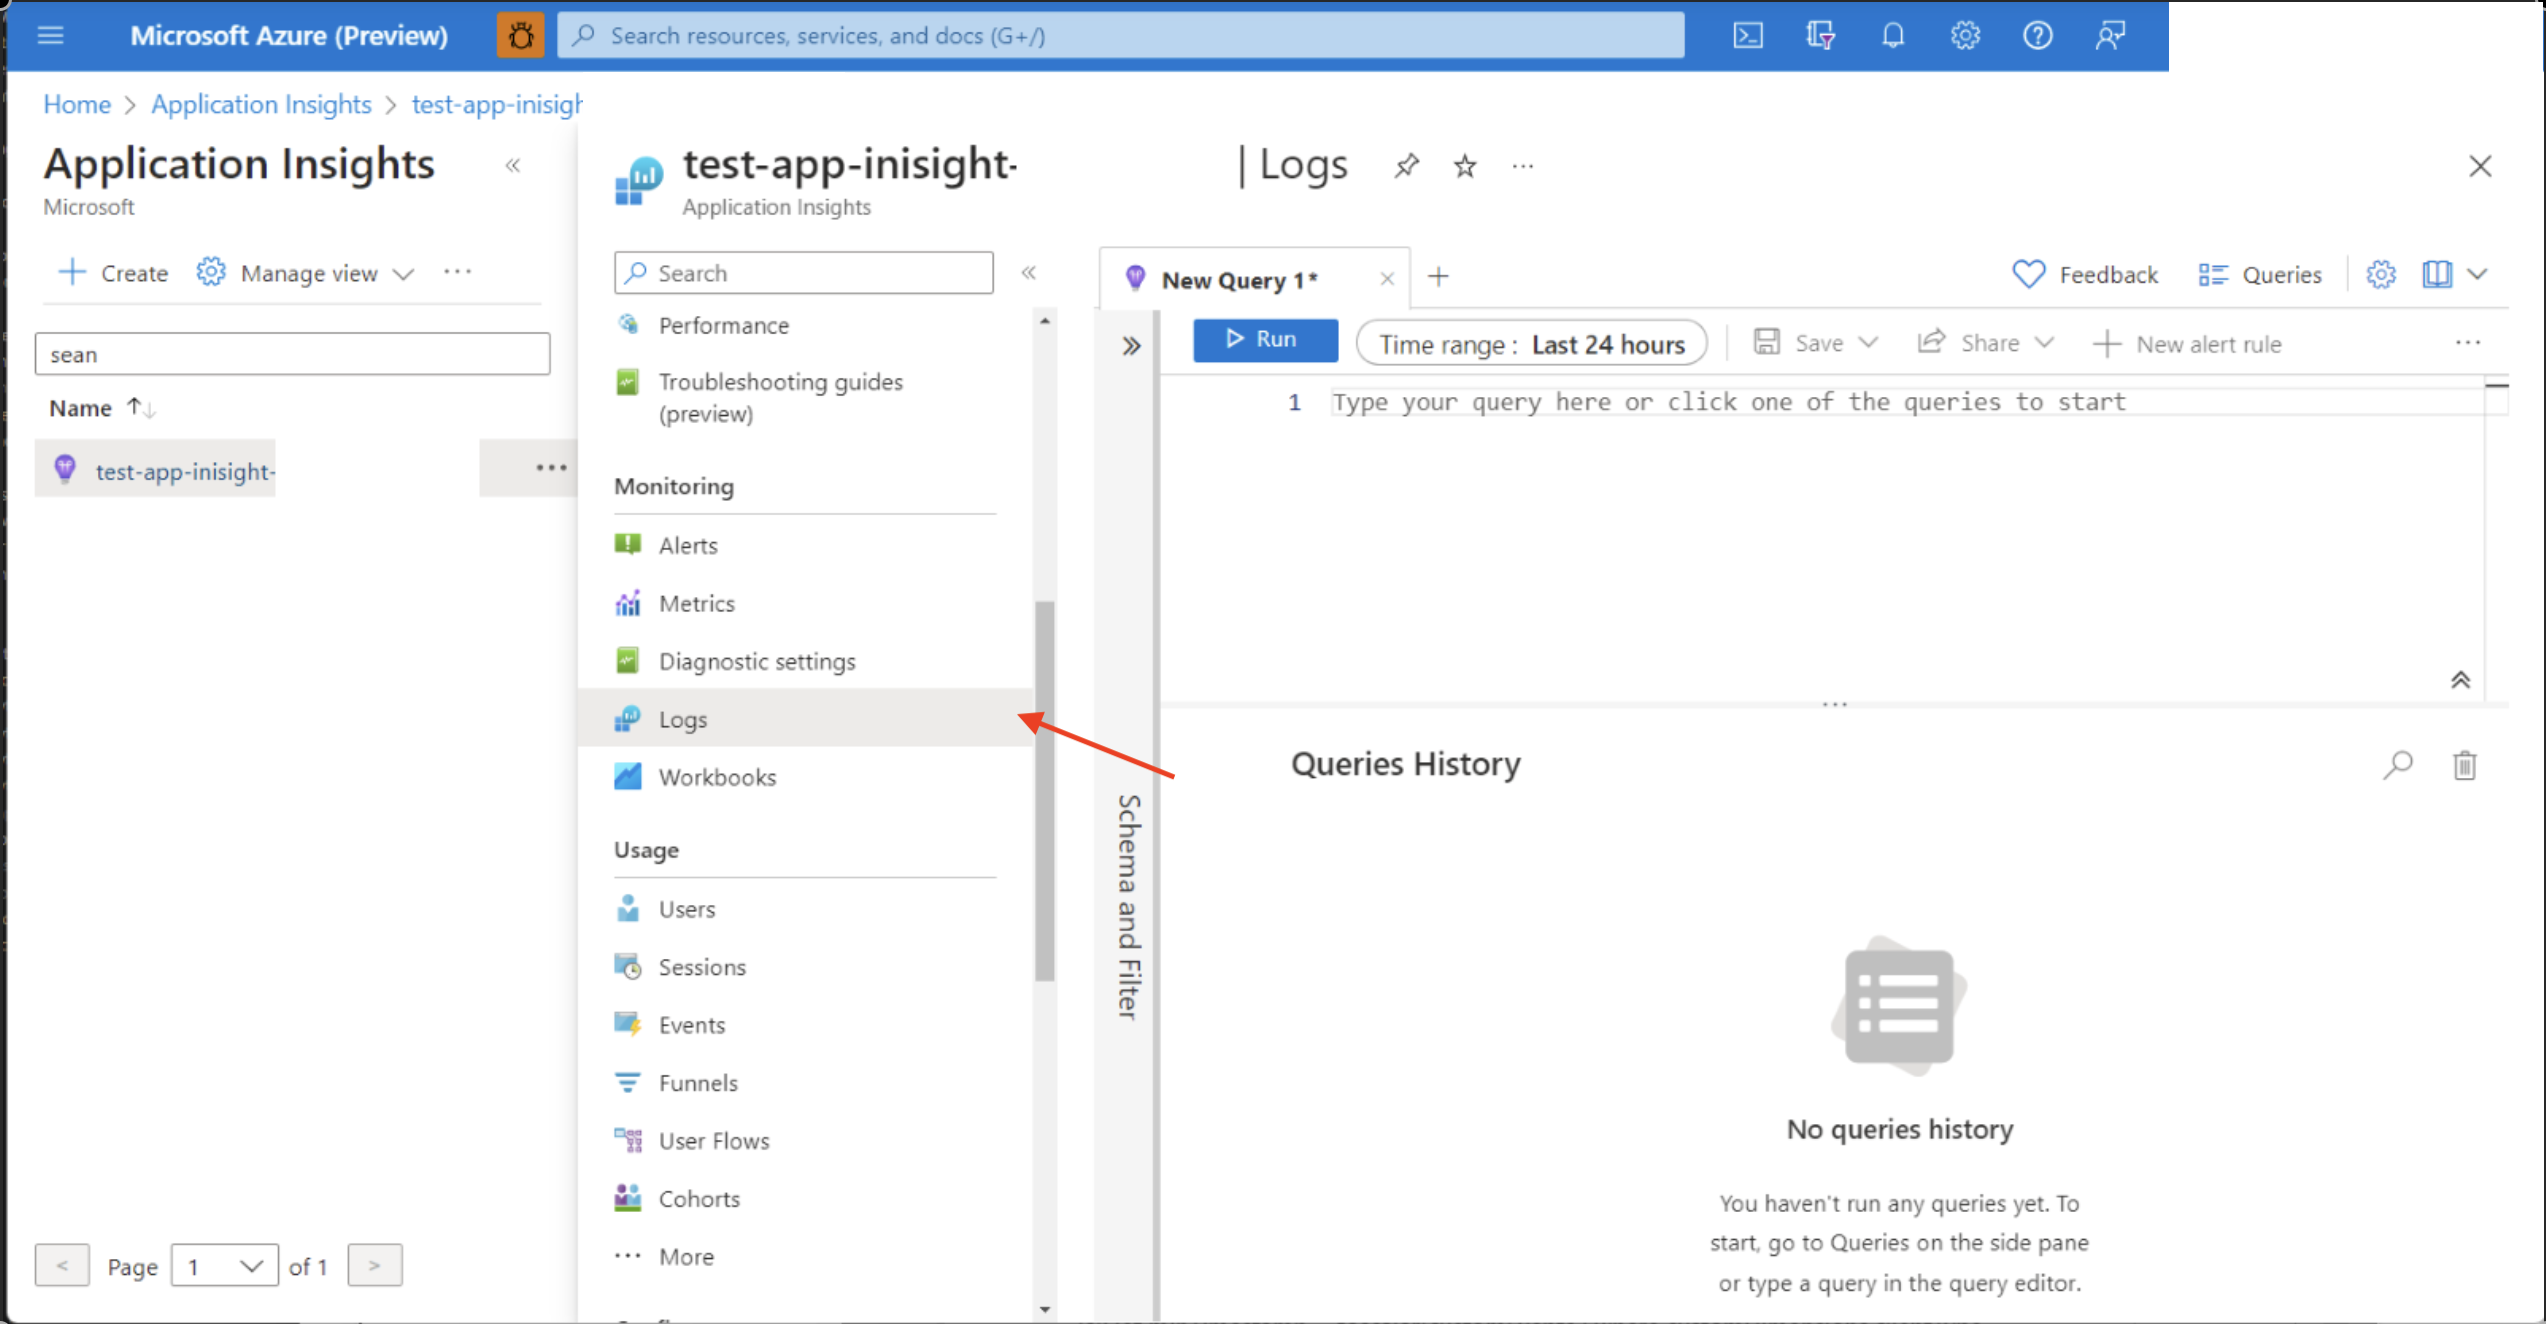
Now, close out the Queries pane if it showed up for you and you will be in the view where we can execute our queries. Note that if you are using the Fluid Azure App Insights logger, your telemetry data will be available in the customEvents table.
Queries and results
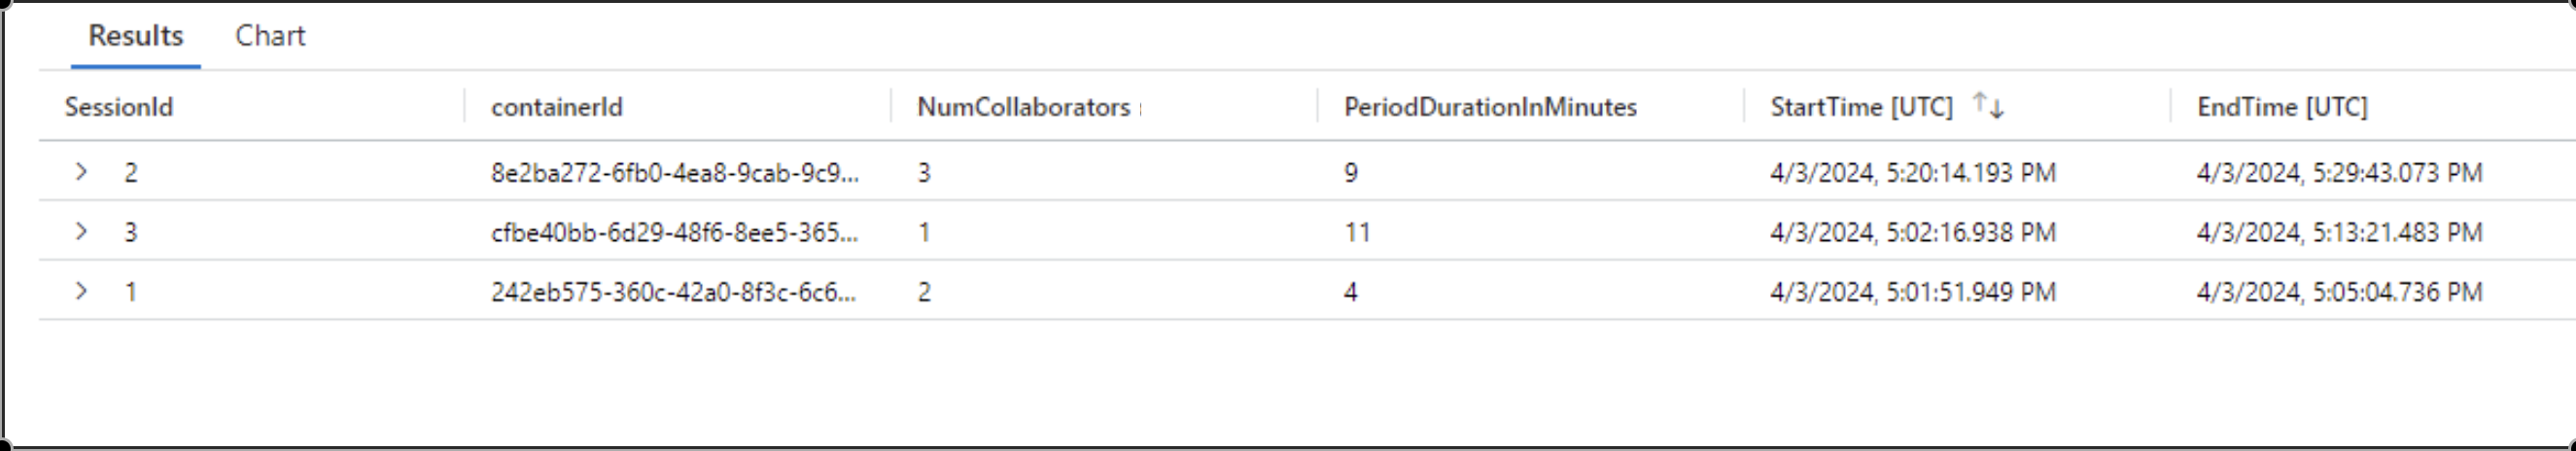
- Session information
The following query provides a table of data that can give you a quick overview of information about sessions for your application. It includes the Id of the container being interacted with, the number of containers and the length of each session. Note that query provides session id's but these values do not actually exist in the telemetry, it is a concept we have derived from the data; see the intro paragraph for more information on sessions.
let sessionGap = 5m;
let sessionGapSeconds = toint(sessionGap / 1s);
customEvents
| extend containerId = tostring(customDimensions.containerId), containerInstanceId = tostring(customDimensions.containerInstanceId )
| where name startswith "fluidframework.container"
| extend containerIdTimestamp = strcat(containerId, timestamp)
| sort by containerIdTimestamp asc
| extend prevTimestamp = prev(timestamp), prevContainerId = prev(containerId)
| extend Diff = datetime_diff("second", timestamp, prevTimestamp)
| extend IsNewPeriod = iif(prevContainerId != containerId or Diff > (sessionGapSeconds) or isnull(Diff), 1, 0)
| extend SessionId = row_cumsum(IsNewPeriod)
| summarize NumCollaborators = dcount(containerInstanceId), StartTime = min(timestamp), EndTime = max(timestamp) by SessionId, containerId
| extend PeriodDurationInMinutes = datetime_diff("minute", EndTime, StartTime)
| project SessionId, containerId , NumCollaborators, PeriodDurationInMinutes, StartTime, EndTime
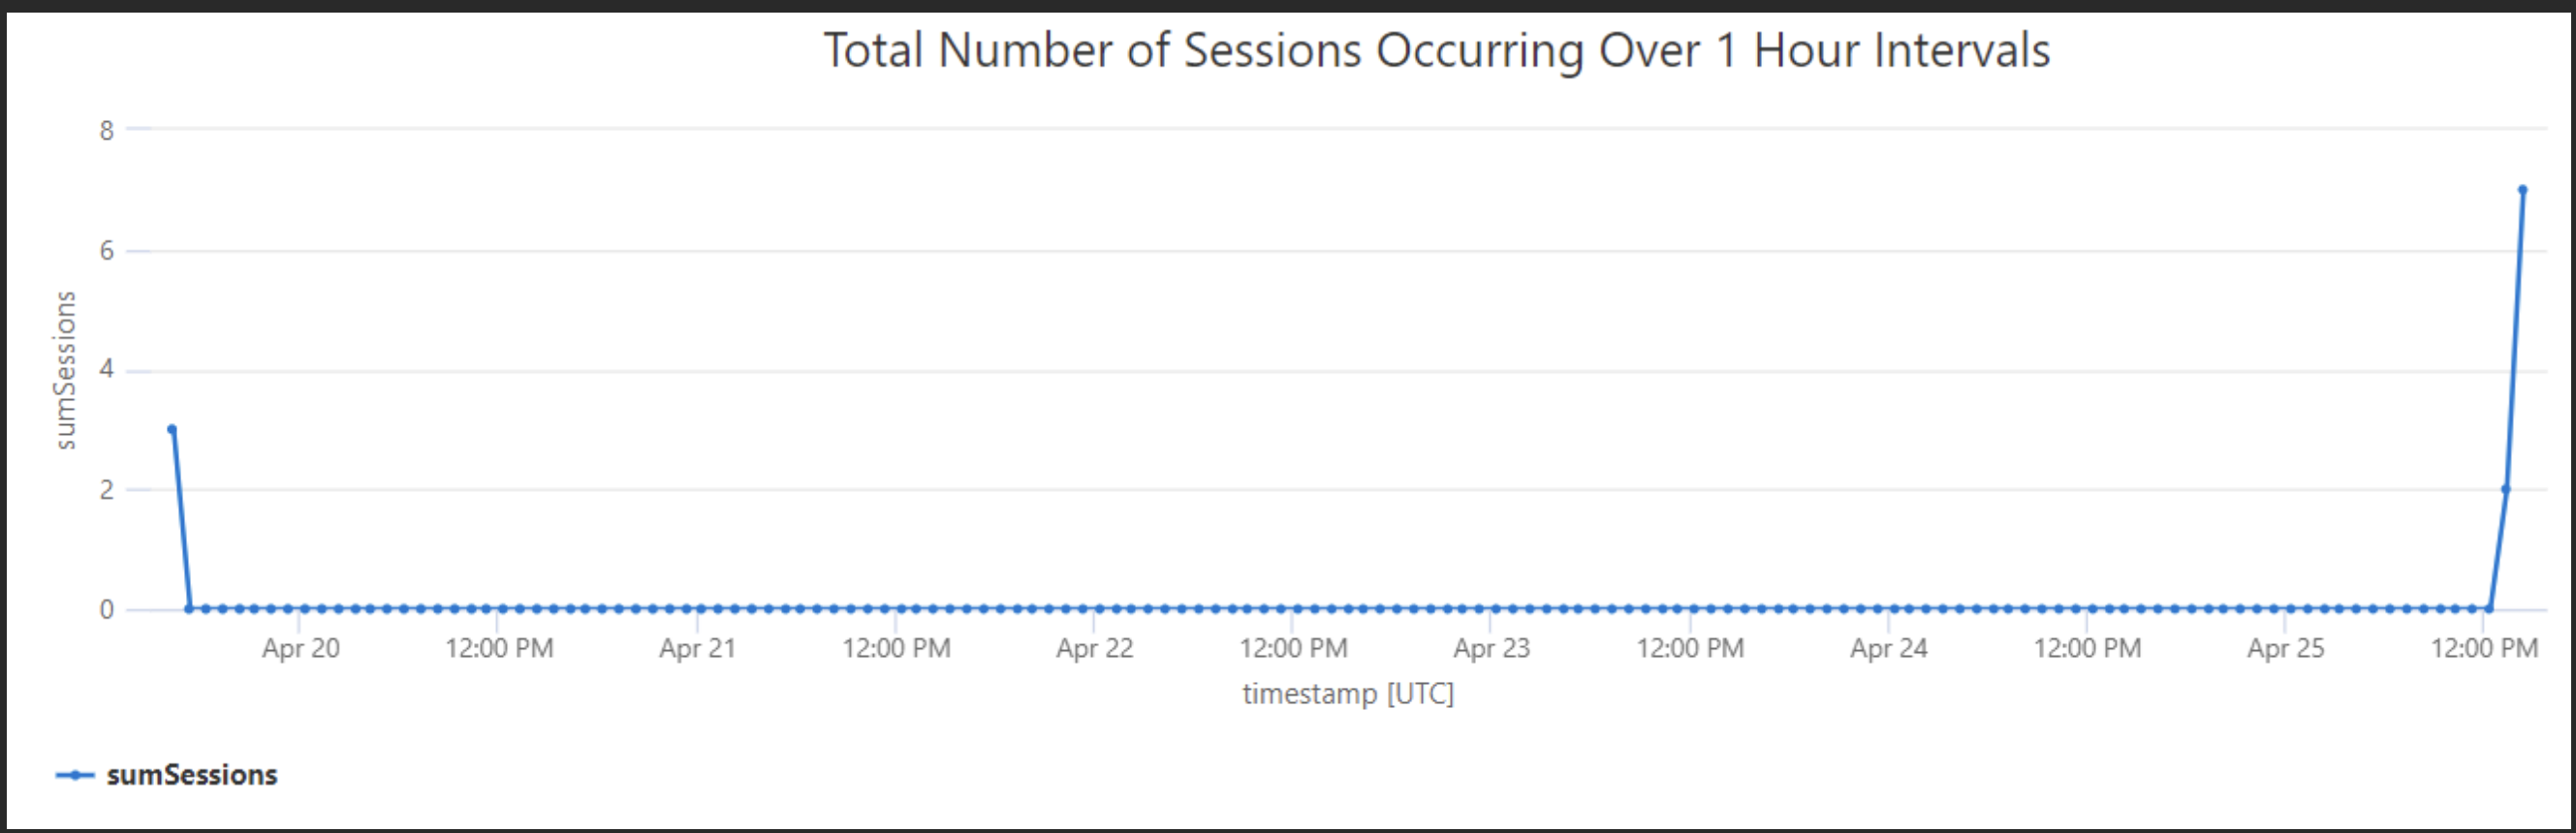
- Total number of sessions over time period
The following query provides the average number of total sessions occurring over 10-minute intervals. The query logic graphs the total number of sessions occurring over 10-minute data points denoted by the variable named summedDataPointInterval.
This variable can be adjusted to your liking, for example, replace let summedDataPointInterval = 10m; with let summedDataPointInterval = 1hr; for 1hr data points.
let summedDataPointInterval = 10m;
let averagedTimeInterval = 1hr;
let sessionGap = 5m;
let sessionGapSeconds = toint(sessionGap / 1s);
let minTimestamp = toscalar(customEvents | where name startswith "fluidframework.container" | summarize min(timestamp));
let maxTimestamp = toscalar(customEvents | where name startswith "fluidframework.container" | summarize max(timestamp));
customEvents
| extend containerId = tostring(customDimensions.containerId)
| where name startswith "fluidframework.container"
| extend docIdTimestamp = strcat(containerId, timestamp)
| sort by docIdTimestamp asc
| extend prevTimestamp = prev(timestamp), prevContainerId = prev(containerId)
| extend Diff = datetime_diff("second", timestamp, prevTimestamp)
| extend IsNewPeriod = iif(prevContainerId != containerId or Diff > (sessionGapSeconds) or isnull(Diff), 1, 0)
| extend SessionId = row_cumsum(IsNewPeriod)
| summarize by SessionId, containerId, bin(timestamp, summedDataPointInterval)
| make-series sumSessions = dcount(SessionId) on timestamp from minTimestamp to maxTimestamp step averagedTimeInterval
| render timechart with (title = "Total Number of Sessions Occurring Over 1 Hour Intervals")
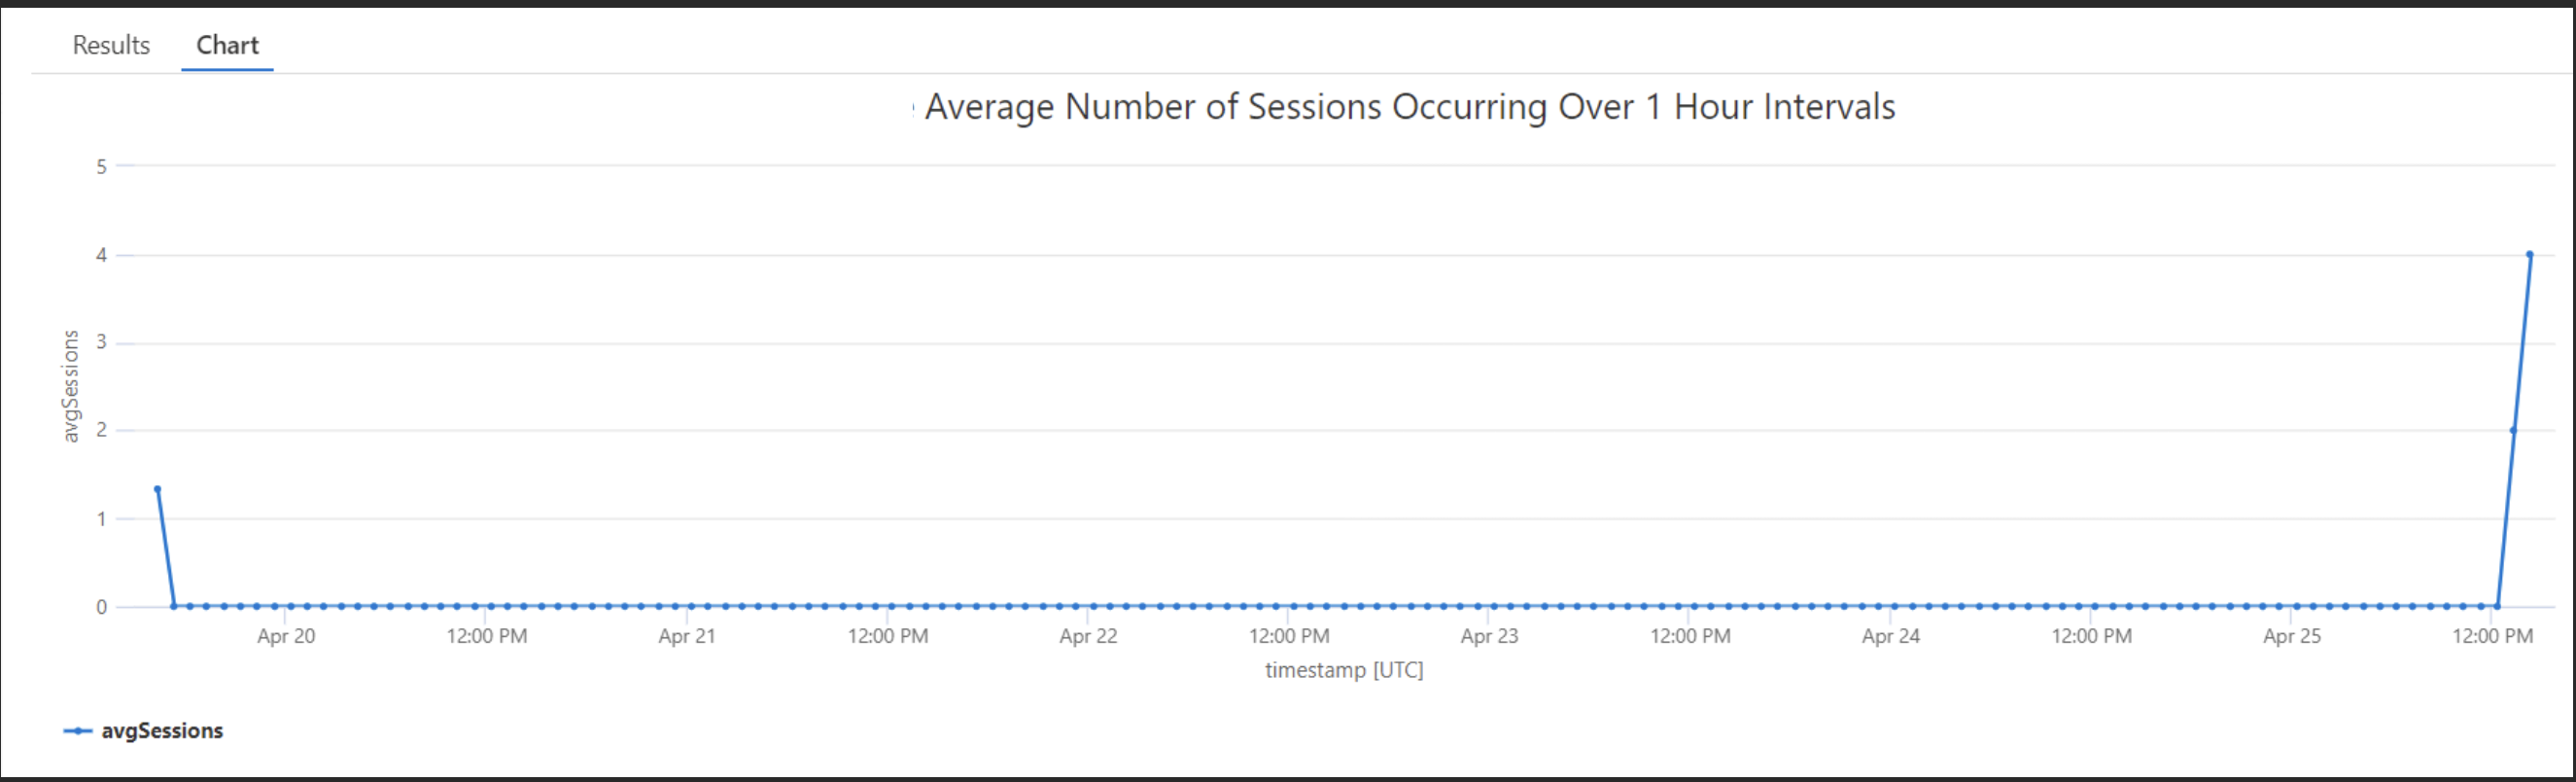
- Average number of sessions over time period
The following query provides the average number of sessions occurring over 1-hour intervals. The query logic first sums up the total number of sessions occurring over 10-minute data points denoted by the variable named summedDataPointInterval. It then averages these data points over 1-hour intervals denoted by the averagedTimeInterval variable.
Both variables can be adjusted to your preference, For example, replace let summedDataPointInterval = 10m; with let summedDataPointInterval = 1hr; for 1-hour data points and replace let averagedTimeInterval = 1hr; with let averagedTimeInterval = 1d; for 1 hour data points averaged over 1 day time intervals.
let summedDataPointInterval = 5m;
let averagedTimeInterval = 20m;
let sessionGap = 5m;
let sessionGapSeconds = toint(sessionGap / 1s);
let minTimestamp = toscalar(customEvents | where name startswith "fluidframework.container" | summarize min(timestamp));
let maxTimestamp = toscalar(customEvents | where name startswith "fluidframework.container" | summarize max(timestamp));
customEvents
| extend containerId = tostring(customDimensions.containerId)
| where name startswith "fluidframework.container"
| extend containerIdTimestamp = strcat(containerId, timestamp)
| sort by containerIdTimestamp asc
| extend prevTimestamp = prev(timestamp), prevContainerId = prev(containerId)
| extend Diff = datetime_diff("second", timestamp, prevTimestamp)
| extend IsNewPeriod = iif(prevContainerId != containerId or Diff > (sessionGapSeconds) or isnull(Diff), 1, 0)
| extend SessionId = row_cumsum(IsNewPeriod)
| summarize sumSessions = dcount(SessionId) by bin(timestamp, summedDataPointInterval)
| make-series avgSessions = avg(sumSessions) on timestamp from minTimestamp to maxTimestamp step averagedTimeInterval
| render timechart with (title = "Average Number of Sessions Occurring Over 1 Hour Intervals")
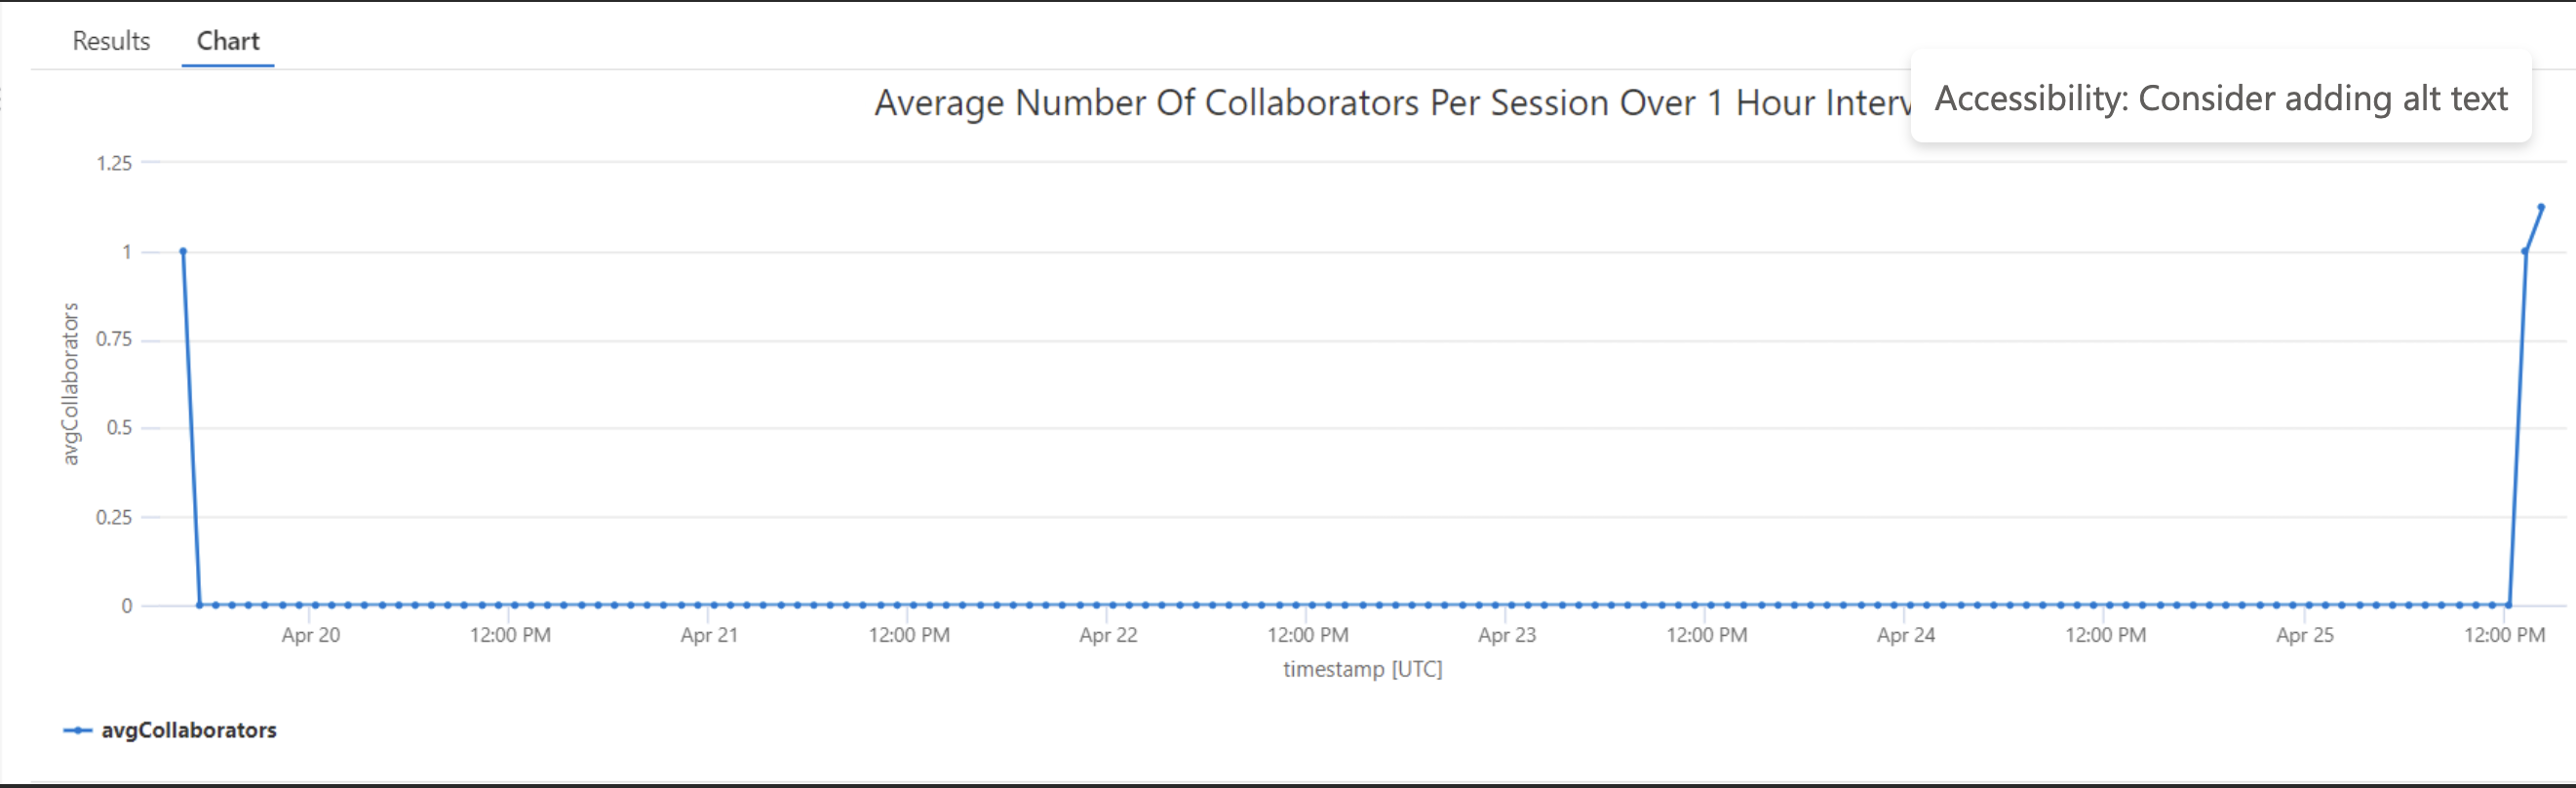
- Average number of containers per session over a time period
The following query will provide you with the approximate average number of containers per session over 1 hour time intervals. The query logic first sums up the total number of containers per sessions occurring over 10-minute data points denoted by the variable named summedDataPointInterval. It then averages these datapoints over 1-hour intervals denoted by the averagedTimeInterval variable.
Both variables can be adjusted to your preference, For example, replace let summedDataPointInterval = 10m; with let summedDataPointInterval = 1hr; for 1-hour data points and replace let averagedTimeInterval = 1hr; with let averagedTimeInterval = 1d; for 1 hour data points averaged over 1 day time intervals.
let summedDataPointInterval = 10m;
let averagedTimeInterval = 1hr;
let sessionGap = 5m;
let sessionGapSeconds = toint(sessionGap / 1s);
let minTimestamp = toscalar(customEvents | where name startswith "fluidframework.container" | summarize min(timestamp));
let maxTimestamp = toscalar(customEvents | where name startswith "fluidframework.container" | summarize max(timestamp));
customEvents
| extend containerId = tostring(customDimensions.containerId), containerInstanceId = tostring(customDimensions.containerInstanceId)
| where name startswith "fluidframework.container"
| extend docIdTimestamp = strcat(containerId, timestamp)
| sort by docIdTimestamp asc
| extend prevTimestamp = prev(timestamp), prevContainerId = prev(containerId)
| extend Diff = datetime_diff("second", timestamp, prevTimestamp)
| extend IsNewPeriod = iif(prevContainerId != containerId or Diff > (sessionGapSeconds) or isnull(Diff), 1, 0)
| extend SessionId = row_cumsum(IsNewPeriod)
| summarize sumCollaborators = dcount(containerInstanceId) by SessionId, containerId, bin(timestamp, summedDataPointInterval)
| make-series avgCollaborators = avg(sumCollaborators) on timestamp from minTimestamp to maxTimestamp step averagedTimeInterval
| render timechart with (title = "Approximate Average Number Of Container Per Session Over 1 Hour Intervals")
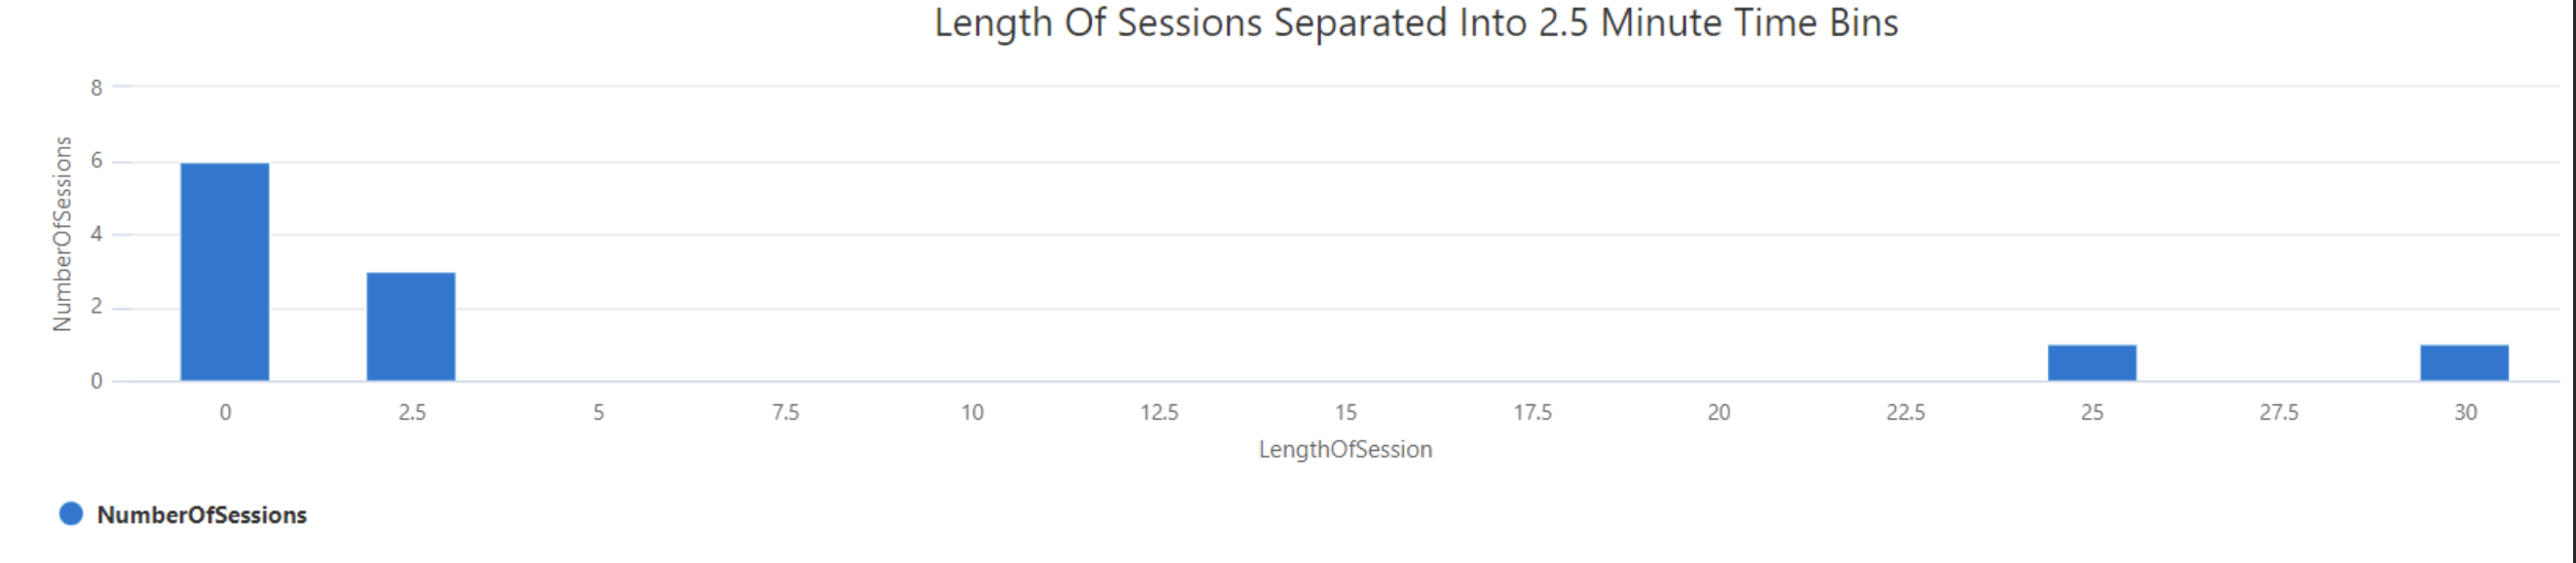
- Length of Individual Sessions in Minutes
This query provides you with the length of time of individual sessions, graphed by putting them into time bins increasing in 2.5 minute increments. The query logic calculates the length of time of each session that occurs and then sorts them into time bins going up in 2.5 minute increments denoted by the let sessionLengthMinuteBins = 2.5; variable. To adjust the 2.5 minute time bins, simply modify the sessionLengthMinuteBins variable. Note that this number represents minutes.
let sessionLengthMinuteBins = 2.5;
let sessionGap = 5m;
let sessionGapSeconds = toint(sessionGap / 1s);
let minTimestamp = toscalar(customEvents | where name startswith "fluidframework.container" | summarize min(timestamp));
let maxTimestamp = toscalar(customEvents | where name startswith "fluidframework.container" | summarize max(timestamp));
customEvents
| extend containerId = tostring(customDimensions.containerId)
| where name startswith "fluidframework.container"
| extend docIdTimestamp = strcat(containerId, timestamp)
| sort by docIdTimestamp asc
| extend prevTimestamp = prev(timestamp), prevContainerId = prev(containerId)
| extend Diff = datetime_diff("second", timestamp, prevTimestamp)
| extend IsNewPeriod = iif(prevContainerId != containerId or Diff > (sessionGapSeconds) or isnull(Diff), 1, 0)
| extend SessionId = row_cumsum(IsNewPeriod)
| summarize StartTime = min(timestamp), EndTime = max(timestamp) by SessionId, containerId
| extend SessionDurationInMinutes = datetime_diff("minute", EndTime, StartTime)
| make-series numSessions = dcount(SessionId) default=0 on sessionLengthBin = bin(SessionDurationInMinutes, sessionLengthMinuteBins) step sessionLengthMinuteBins
| mvexpand sessionLengthBin, numSessions
| extend numSessionsLong = tolong(numSessions), sessionLengthBinDouble = todouble(sessionLengthBin)
| project LengthOfSession = sessionLengthBinDouble, NumberOfSessions = numSessionsLong
| sort by LengthOfSession asc
| render columnchart with (title = "Length Of Sessions Separated Into 2.5 Minute Time Bins")
General Query Adjustments
-
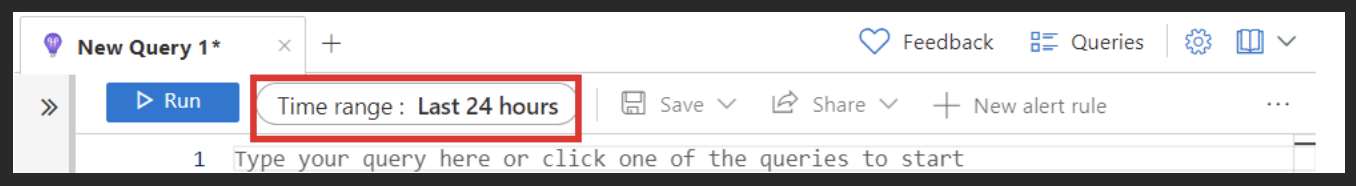
Adjusting the date span of the query
To adjust the time span of this query, simply use the Time Range dropdown provided by azure. You do not need to modify the query directly. By default, these queries will query against all logs you have available.
-
Adjusting the gap of time that defines a session
By default, we identify each session has a period of 5 minutes of inactivity before and after. However, you may want to adjust this time period. To do so, modify the value of the variable named
sessionGapto be your desired time length. -
Adjusting the title of your graphs
For all queries, you can modify the title of your graph using the last line of the query, for example, replace
render columnchart with (title = "Approximate Length Of Sessions Separated Into 2.5 Minute Time Bins")query,with render columnchart with (title = "Approximate Length Of Sessions Separated Into 10 Minute Time Bins")