Logging and telemetry
Telemetry is an essential part of maintaining the health of modern applications. Fluid Framework provides a way to plug in your own logic to handle telemetry events sent by Fluid. This enables you to integrate the Fluid telemetry along with your other telemetry, and route the event data in whatever way you need.
Collect Fluid Framework logs with a custom ITelemetryBaseLogger
The ITelemetryBaseLogger is an interface within the @fluidframework/common-definitions package. This interface can
be implemented and passed into the service client's constructor via the props parameter.
All Fluid service clients (for example, [AzureClient][] and [TinyliciousClient][]) allow passing a logger?: ITelemetryBaseLogger
into the service client props. Both createContainer() and getContainer() methods will then create an instance of the logger.
TinyliciousClientProps interface definition takes an optional parameter logger.
const loader = new Loader({
	urlResolver: this.urlResolver,
	documentServiceFactory: this.documentServiceFactory,
	codeLoader,
	logger: tinyliciousContainerConfig.logger,
});
The Loader constructor is called by both createContainer() and getContainer(), and requires a ILoaderProps
interface as its constructor argument. ILoaderProps interface has an optional logger parameter that will take the
ITelemetryBaseLogger defined by the user.
ILoaderProps.logger
is used by Loader to pipe to container's telemetry system.
Properties and methods
The interface contains a send() method as shown:
export interface ITelemetryBaseLogger {
	send(event: ITelemetryBaseEvent): void;
}
send()- The
send()method is called by the container's telemetry system whenever a telemetry event occurs. This method takes in an ITelemetryBaseEvent type parameter, which is also within the@fluidframework/common-definitionspackage. Given this method is part of an interface, users can implement a custom telemetry logic for the container's telemetry system to execute.
- The
Customizing the logger object
In some cases you may wish to add custom attributes to the object implementing the ITelemetryBaseLogger interface. For
example, you may wish to handle some categories differently than others, or you may want to label categories based on
the input.
Regardless of your logic, ITelemetryBaseLogger must be implemented, and you must call the send() method ultimately
since it is the actual method that is piped to the container's telemetry system and sends the telemetry events.
To see an example of building custom logic into the telemetry implementation, see the ITelemetryLogger interface
snippets below, or in the @fluidframework/common-definitions package for full details.
// @public
export interface ITelemetryLogger extends ITelemetryBaseLogger {
	send(event: ITelemetryBaseEvent): void;
	sendErrorEvent(event: ITelemetryErrorEvent, error?: any): void;
	sendPerformanceEvent(event: ITelemetryPerformanceEvent, error?: any): void;
	sendTelemetryEvent(event: ITelemetryGenericEvent, error?: any): void;
}
ITelemetryLogger interface breaks down telemetry events into different categories, and will contains different logic
for different events.
/**
 * Send a telemetry event with the logger
 *
 * @param event - the event to send
 * @param error - optional error object to log
 */
public sendTelemetryEvent(event: ITelemetryGenericEvent, error?: any) {
  const newEvent: ITelemetryBaseEvent = {
    ...event,
    category: event.category ?? (error === undefined ?  "generic" : "error"),
  };
  if (error !== undefined) {
    TelemetryLogger.prepareErrorObject(newEvent, error, false);
  }
  this.send(newEvent);
}
Like demonstrated here, it is imperative to ensure send() is ultimately called at the end of custom properties.
This ensures that information is piped to the container's telemetry system, and that the telemetry event is correctly fired.
ITelemetryBaseEvent interface
All Fluid telemetry events are sent as ITelemetryBaseEvents via the send() method in ITelemetryBaseLogger. This
interface can be augmented, allowing you to add additional properties that will be serialized as JSON. The default
required properties, eventName and category, are set by the telemetry system.
export interface ITelemetryBaseEvent extends ITelemetryProperties {
	category: string;
	eventName: string;
}

export interface ITelemetryProperties {
	[index: string]: TelemetryEventPropertyType | ITaggedTelemetryPropertyType;
}

export interface ITaggedTelemetryPropertyType {
	value: TelemetryEventPropertyType;
	tag: string;
}

export type TelemetryEventPropertyType = string | number | boolean | undefined;
The ITelemetryBaseEvent interface contains category and eventName properties for labeling and defining a telemetry event,
and extends ITelemetryProperties which has a string index signature. The values of the index signature are
either tagged (ITaggedTelemetryPropertyType) or untagged (TelemetryEventPropertyType) primitives (string,
boolean, number, undefined).
Understanding Tags
Tags are strings used to classify the properties on telemetry events. By default, telemetry properties are untagged. However,
the Fluid Framework may emit events with some properties tagged, so implementations of ITelemetryBaseLogger must be
prepared to check for and interpret any tags. Generally speaking, when logging to the user's console, tags can
be ignored and tagged values logged plainly, but when transmitting tagged properties to a telemetry service,
care should be taken to only log tagged properties where the tag is explicitly understood to indicate the value
is safe to log from a data privacy standpoint.
Category
The Fluid Framework sends events in the following categories:
- error -- used to identify and report error conditions, e.g. duplicate data store IDs.
- performance -- used to track performance-critical code paths within the framework. For example, the summarizer tracks how long it takes to create or load a summary and reports this information in an event.
- generic -- used as a catchall for events that are informational and don't represent an activity with a duration like a performance event.
EventName
This property contains a unique name for the event. The name may be namespaced, delimited by a colon ':'.
Additionally, some event names (not the namespaces) contain underscores '_', as a free-form subdivision of
events into different related cases. Once common example is foo_start, foo_end and foo_cancel for
performance events.
Customizing logged events
Similar to the ITelemetryBaseLogger interface mentioned above, different levels of event complexity can also be
achieved by adding other attributes to the object implementing the ITelemetryBaseEvent interface. Below are some
examples:
if (chunk.version !== undefined) {
	logger.send({
		eventName: "MergeTreeChunk:serializeAsMinSupportedVersion",
		category: "generic",
		fromChunkVersion: chunk.version,
		toChunkVersion: undefined,
	});
}
The code snippet here implements a telemetry event without adding much complexity. The telemetry event object here adds
only a few other attributes to the ITelemetryBaseEvent.
/**
 * Send a telemetry event with the logger
 *
 * @param event - the event to send
 * @param error - optional error object to log
 */
public sendTelemetryEvent(event: ITelemetryGenericEvent, error?: any) {
  const newEvent: ITelemetryBaseEvent = {
    ...event,
    category: event.category ?? (error === undefined ?  "generic" : "error"),
  };
  if (error !== undefined) {
    TelemetryLogger.prepareErrorObject(newEvent, error, false);
  }
  this.send(newEvent);
}
However, the code snippet here shows a telemetry event object that adds much more complex logic to determine the event
that has occurred, then passes the resulting event to the send() method for the container's telemetry system to
output.
Here is the above telemetry event object in action:
this.logger.sendTelemetryEvent({
	eventName: "connectedStateRejected",
	source,
	pendingClientId: this.pendingClientId,
	clientId: this.clientId,
	hasTimer: this.prevClientLeftTimer.hasTimer,
	inQuorum:
		protocolHandler !== undefined &&
		this.pendingClientId !== undefined &&
		protocolHandler.quorum.getMember(this.pendingClientId) !== undefined,
});
Because you can customize the logic, you can send these events to your own external telemetry system to have them logged. This enables you to integrate Fluid Framework logging with your other telemetry.
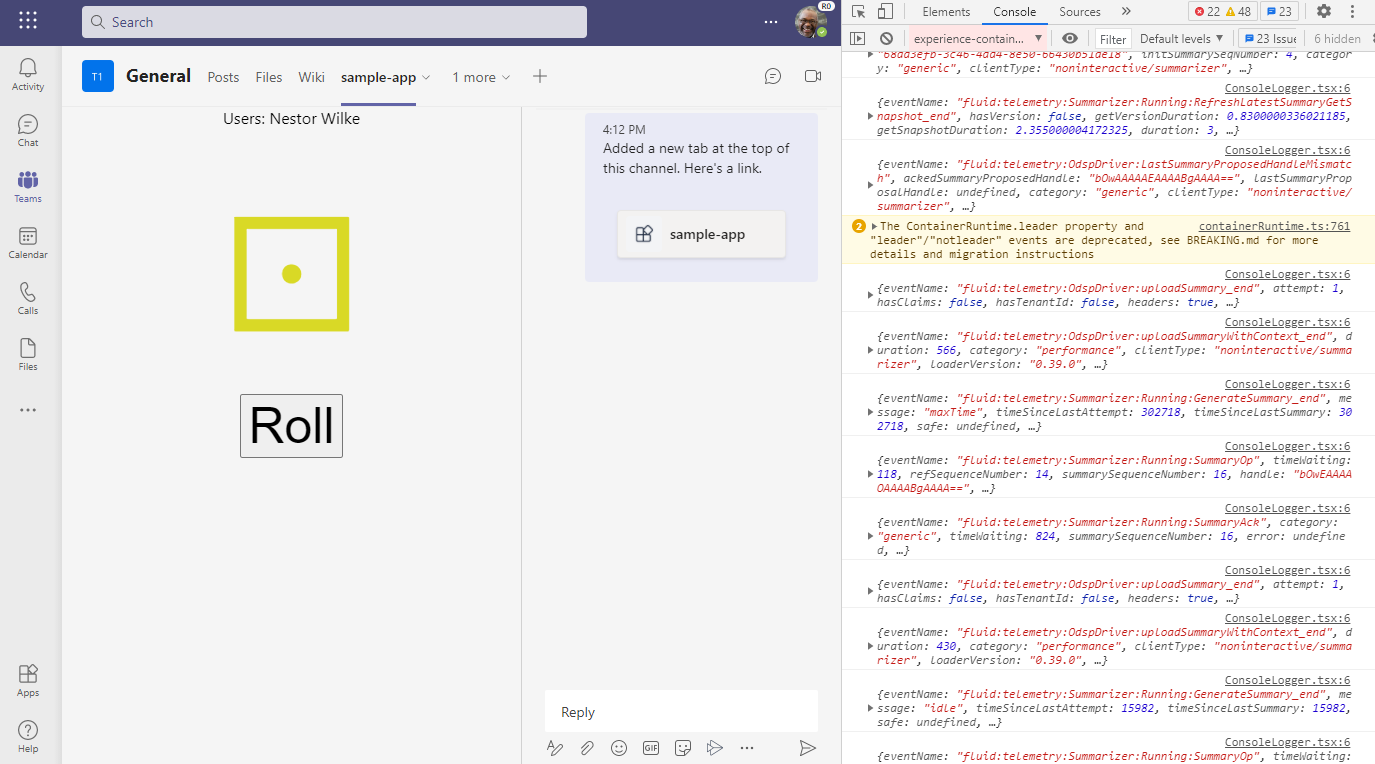
Code example
With the interface already hooked up to the container's telemetry system, it is easy for users to write a custom
telemetry object by implementing the ITelemetryBaseLogger interface and defining the send() method. Below is an
example custom telemetry logger, ConsoleLogger, that implements the ITelemetryBaseLogger interface. As the name
suggests, the ConsoleLogger defined the send() method to stringify the entire event object and print it to the
browser console.
import { ITelemetryBaseLogger, ITelemetryBaseEvent } from "@fluidframework/core-interfaces";

// Define a custom ITelemetry Logger. This logger will be passed into TinyliciousClient
// and gets hooked up to the Tinylicious container telemetry system.
export class ConsoleLogger implements ITelemetryBaseLogger {
	constructor() {}
	send(event: ITelemetryBaseEvent) {
		console.log("Custom telemetry object array: ".concat(JSON.stringify(event)));
	}
}
This custom logger should be provided in the service client constructor. Fluid will create an instance of the logger when creating or getting the container. The custom logger is hooked up to the container's telemetry system by the time the container is returned.
async function start(): Promise<void> {
  // Create a custom ITelemetryBaseLogger object to pass into the Tinylicious container
  // and hook to the Telemetry system
  const client = new TinyliciousClient({logger: new ConsoleLogger()});
  let container: FluidContainer;
  let services: TinyliciousContainerServices;

  // Get or create the document depending if we are running through the create new flow
  const createNew = !location.hash;
  if (createNew) {
      // The client will create a new detached container using the schema
      // A detached container will enable the app to modify the container before attaching it to the client
      ({container, services} = await client.createContainer(containerSchema));

      // Assign the returned ID to the URL hash for subsequent load flow
      const id = await container.attach();
      location.hash = id;
  }
}
Now, whenever a telemetry event is encountered, the custom send() method gets called and will print out the entire
event object.

The purpose of ConsoleLogger is to demonstrate how the ITelemetryBaseLogger interface should be implemented. In typical usage, developers should instead use the DebugLogger, which is provided by default by the Fluid Framework. See Using DebugLogger below instead of implementing something similar to ConsoleLogger.
Using DebugLogger
The DebugLogger offers a convenient way to output all telemetry events to the console. DebugLogger is present by default when creating/getting a container, and no extra steps are required to use it.
Under the hood, DebugLogger uses the debug library. The debug library enables Fluid to send to a unique 'namespace,' fluid. By default these messages are hidden but they can be enabled
in both Node.js and a web browser.
To enable Fluid Framework logging in the browser, set the localStorage.debug variable in the JavaScript console,
after which you will need to reload the page.
localStorage.debug = "fluid:*";
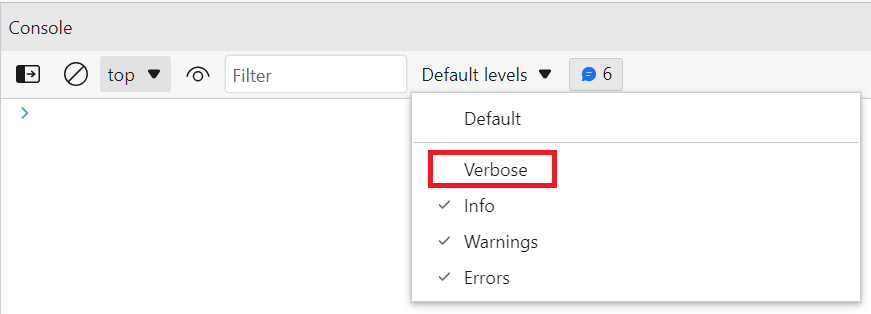
You'll also need to enable the Verbose logging level in the console. The dropdown that controls that is just above it,
to the right of the Filter input box (it might say "Default Levels").

It's not recommended to set localStorage.debug in code; your users will see a very spammy console window if you do.
To enable Fluid Framework logging in a Node.js application, set the DEBUG environment variable when running the app.